Homelab · Build log
Weather apps suck, so I built my own
A weather page for my own hill, with the public forecast models calibrated against my station's history. The bugs were the best part.
September 2026 · 8 min read
The forecast is for somewhere else
Open any weather app at my house and it gives me the nearest station. That station is six miles away and about 700 feet downhill.
The difference matters. My hill is windier than the valley, colder at night, and fogs in when the valley is clear. The app answers a question about a different place and presents the answer as though it were about mine.
I already had an Ambient Weather station on the roof, so I had the observations. What I lacked was a forecast that knew anything about my hill, and that second problem is the interesting one.
What it is
One Python script, standard library only, renders a static HTML page every sixty seconds. A tiny HTTP server serves it and a loop runs it. There is no database, no framework and no build step.
It runs in a python:3.12-slim container on my Unraid server, and the container barely earns its keep: two files and a while trueloop. The page has four views (Current, Radar, Detailed, Discussion), five themes, and installs to a phone home screen as a web app.
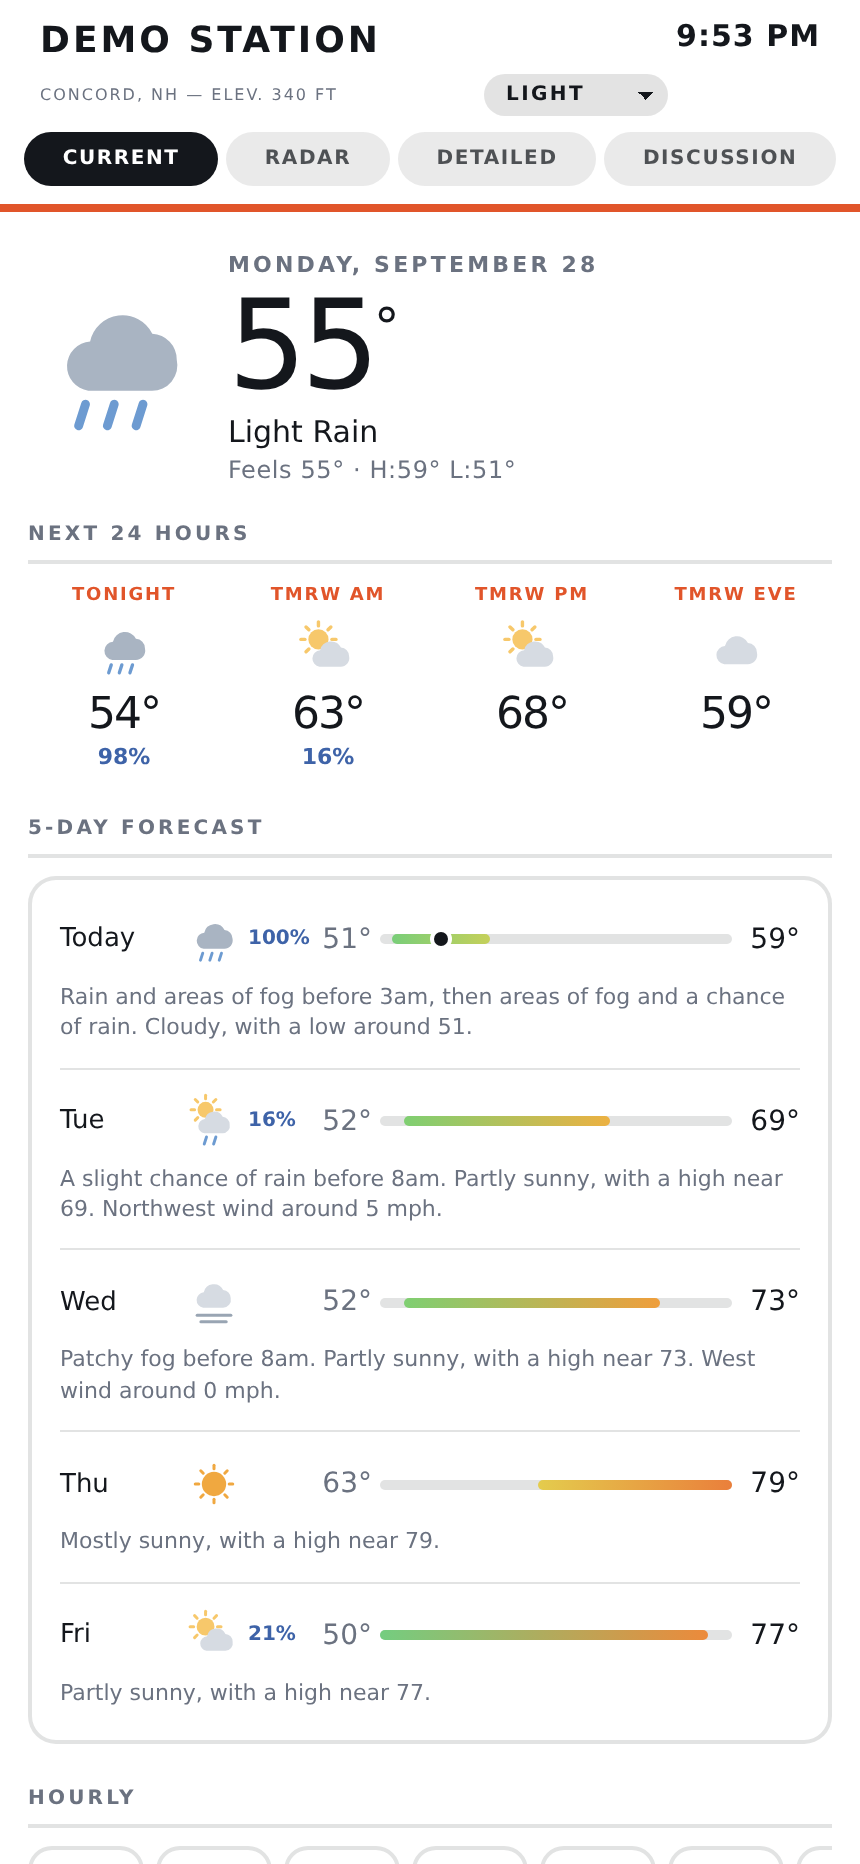
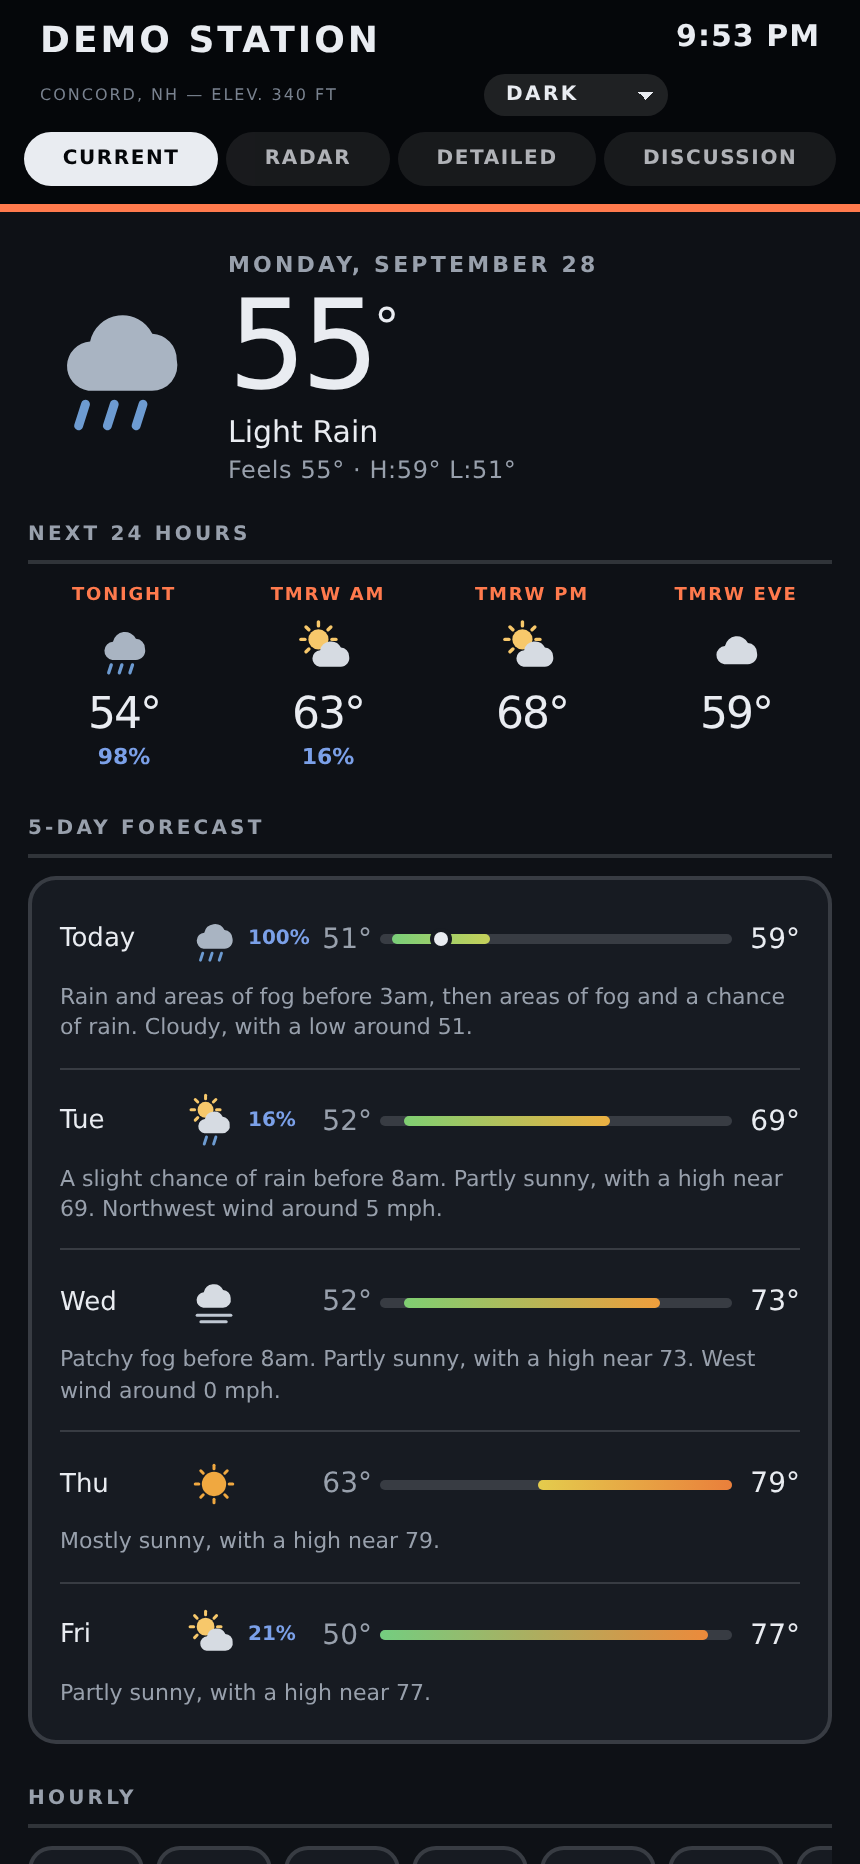
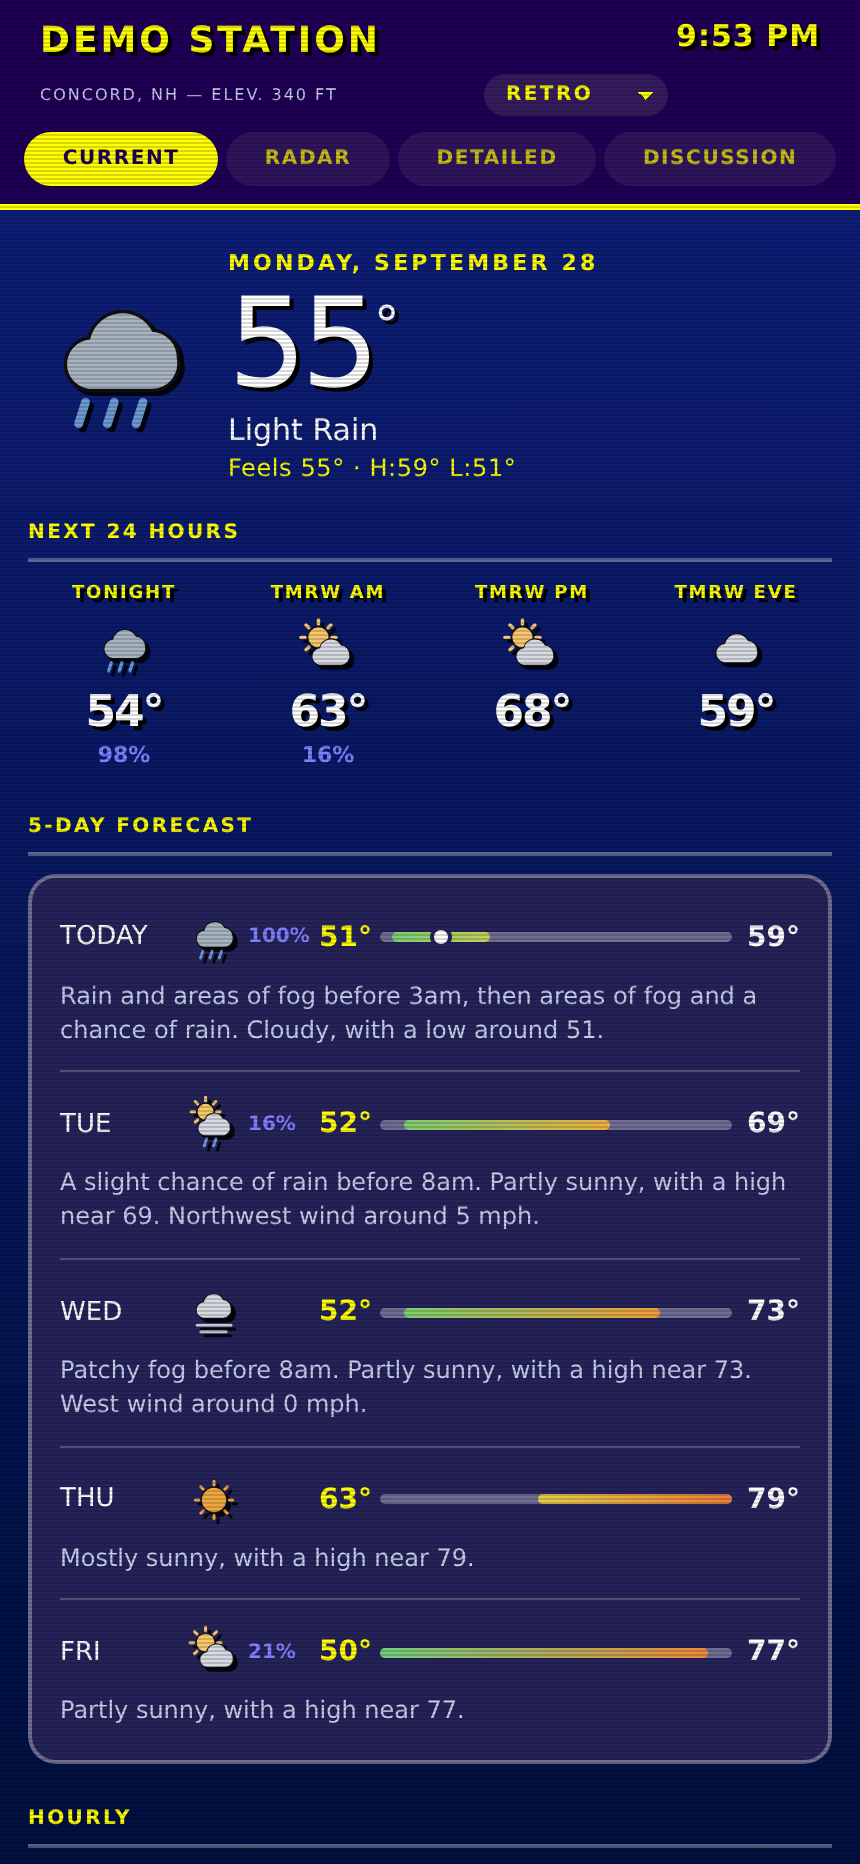
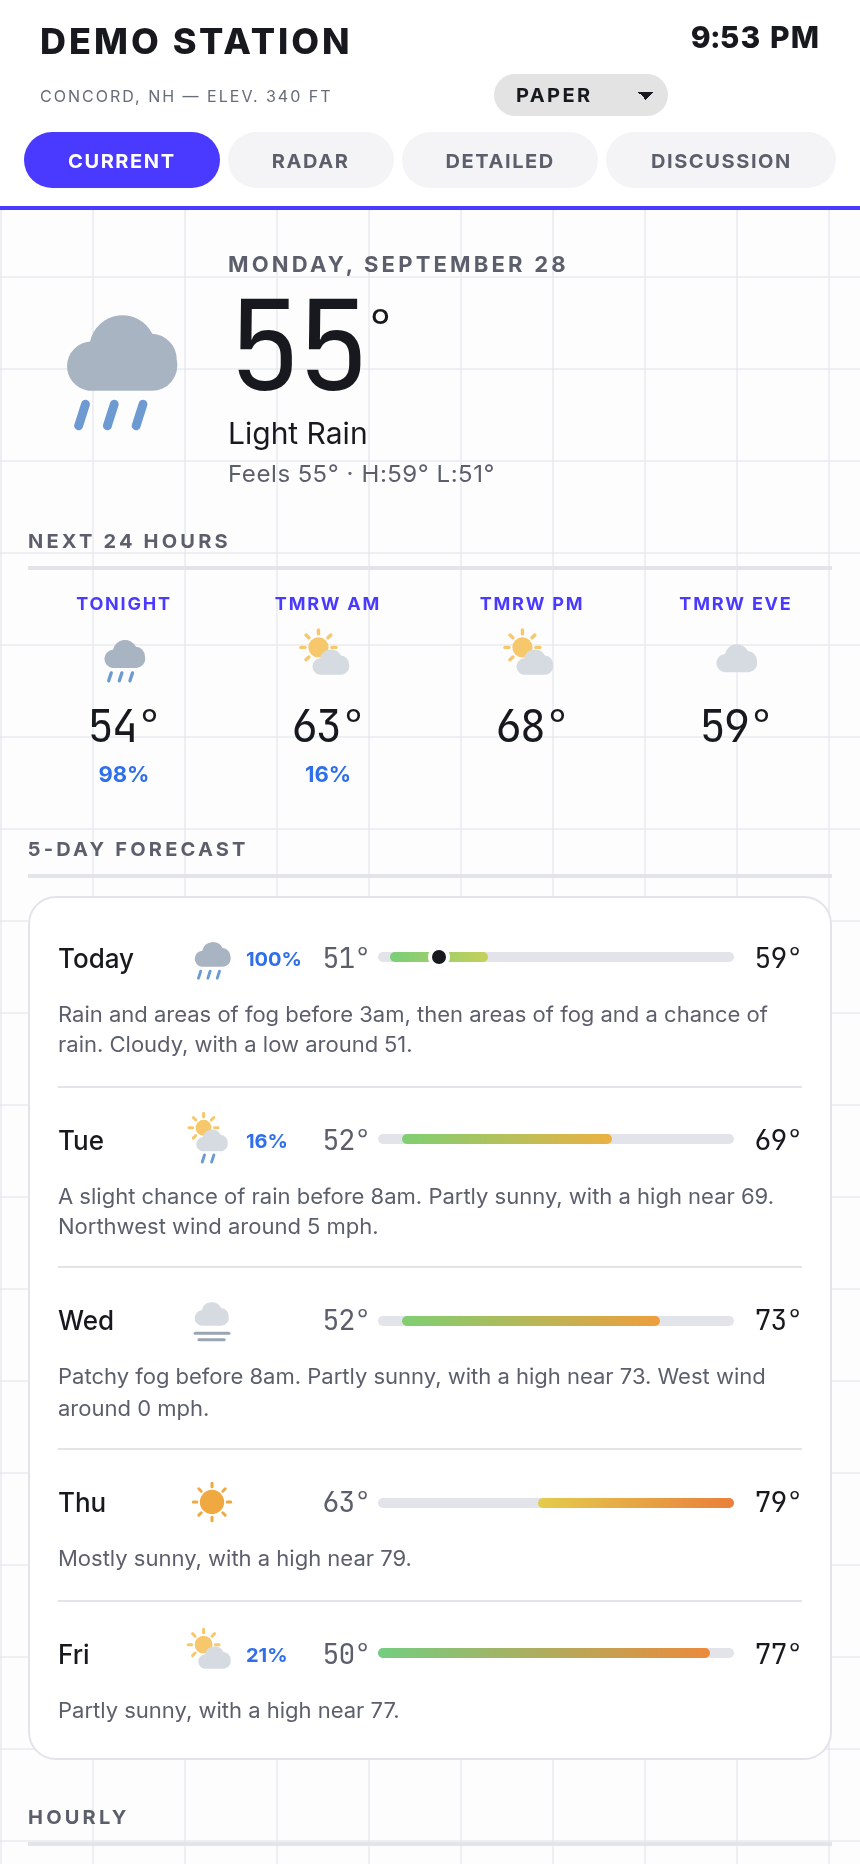
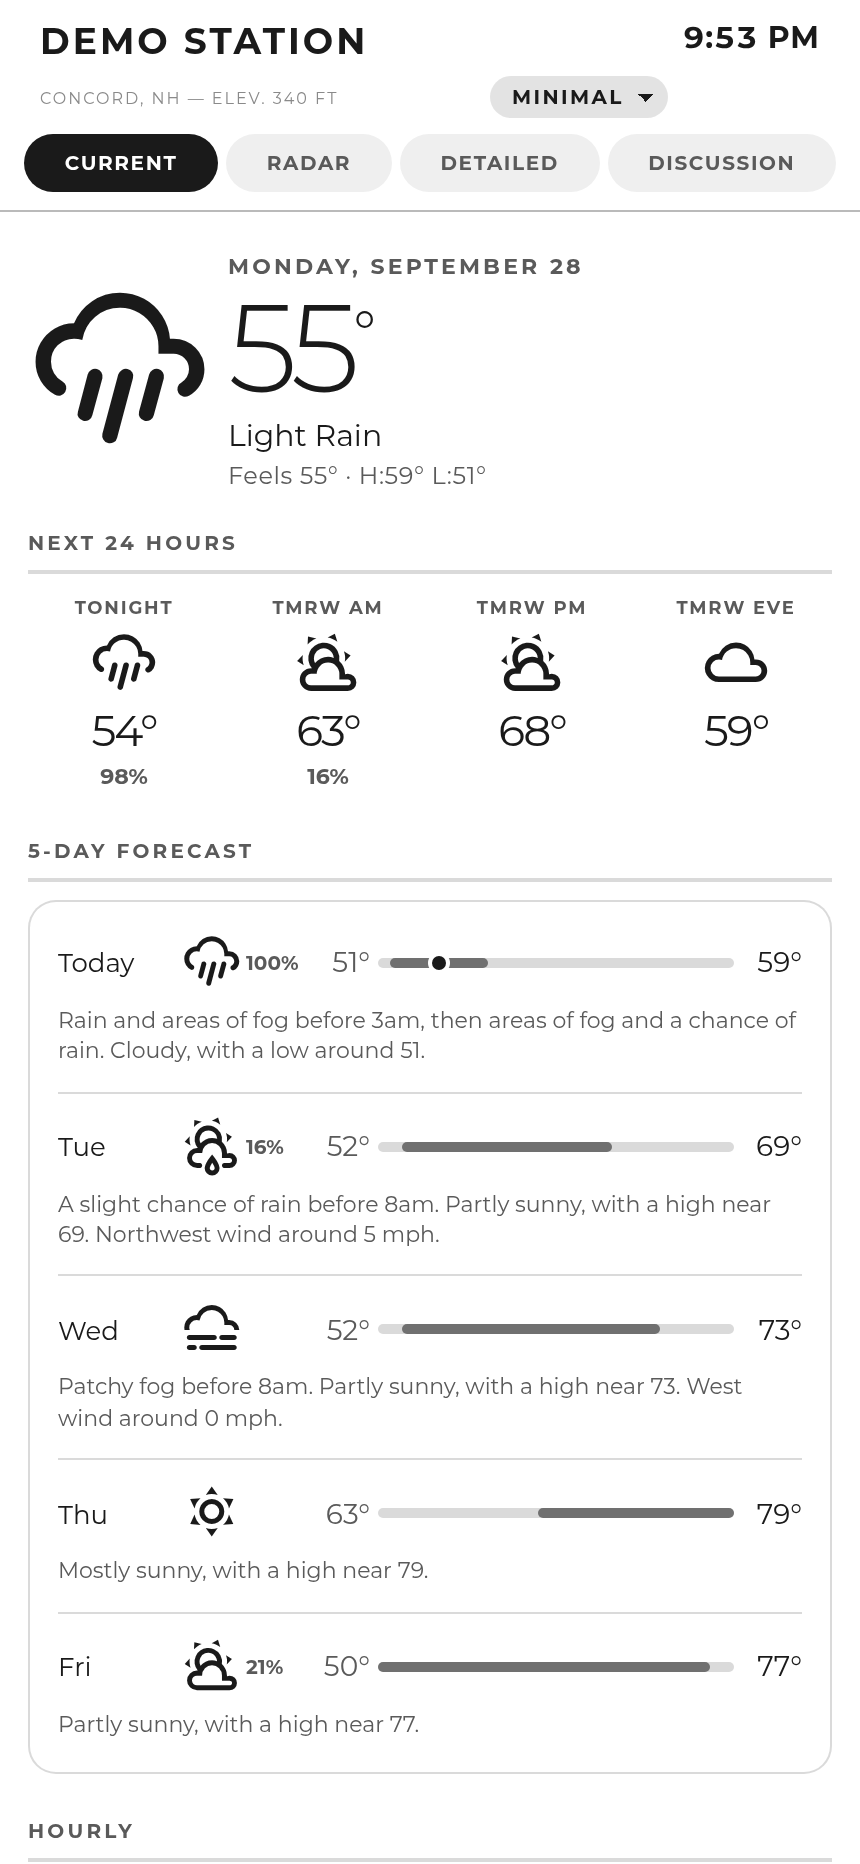
The themes are more fun than they need to be. There is a light one and a dark one, obviously. There is one modeled on the Weather Channel's WeatherStar 4000, with banded blue panels, hard black text shadows and cartoon icons, because if you build your own weather page and skip the WeatherStar theme, what are you even doing. There is a graph-paper one that matches this website, and a gray minimal one for e-ink screens.
Adding a theme turned out to require registering it in four separate places, and only three of them fail loudly. The fourth is a small script that runs before the stylesheet and checks the saved theme against a hardcoded list of names. Forget it and the page paints light, then snaps to your theme on every load.
The part I care about
Anyone can draw a thermometer on a web page. The part worth building was calibrating the public forecast models against my own station's history.
For every day the station has recorded, the page fetches the archived model forecast for that exact point and compares it with what the station measured. The ratio between the two is the correction. Do that per month and per wind direction and you get a table that describes your site.
Mine has the trees in it.
| Month | Forecast to gauge wind factor |
|---|---|
| March (bare) | about 0.30 |
| July (leaf-on) | about 0.15 |
The model says twelve mph and the hill delivers two. That gap is canopy, and it swings by a factor of two between March and July. A general-purpose weather app can't know that about your yard, because it has never seen your yard's history.
Other things the same method turned up:
- Gusts need one flat factor. Mine is about 0.49 and barely moves by season or direction. Sustained wind gets taxed by the trees; gusts are momentum punched down from above and mostly ignore them.
- Pick your precipitation model with evidence. Summed against my gauge over the whole record, ECMWF came in at 86.4% and GFS at 53.5%. GFS reads about half the rain that actually falls here. The page uses ECMWF alone for rain amounts, and I have the numbers for why.
- "Windy" should be relative to your own site. Scoring daily wind run against the station's own percentile distribution turns an abstract number into
30 mi · 81st percentile · breezy.
The bugs are the good part
Three things were wrong for months without looking wrong. That is the real lesson of the project, and it is why I now distrust any dashboard I have not tried to falsify.
Rain read 0.00 every single day. The code took the last record of the day and read its running total. The API returns records newest first, so "last" was 00:05, five minutes after the daily counter resets. The thirty-day rain chart had shown zero for its entire existence. Fixed, the same window showed fifteen wet days and 5.00 inches.
The station's own history file stopped growing in July, and nothing noticed. The code that should have appended to it was already fetching the data and throwing the fields away. It sat frozen at 101 days. It is now at 131 and maintains itself at no extra API cost.
Every single day was classified a "rager." Wind run was computed as sum / 4.0, which assumes fifteen-minute archive records. Ambient logs every five minutes. Every day scored triple against a percentile scale that topped out at 49.7 miles, so nearly every day came back 99th percentile. The same conditions now read 30 mi · 81st · breezy.
None of these threw an error. All three rendered a confident number in a nice font.
A few that were just funny
- The moon never drew, in any theme, ever. The crescent was two arcs, and the return arc's radius was smaller than half its own chord. The SVG spec scales an out-of-range radius up until it fits, so both arcs resolved to the same semicircle on the same center with opposite sweeps. The path enclosed zero area and nothing painted. Every clear night showed no icon. My first fix blamed the fill color, and the dark theme disproved that in one screenshot.
- The moon phase also ran 1.5 days behind for a while. The ephemeris formulas count days from 1999-12-31, and I had assumed the J2000 noon epoch like everyone else.
- Today's high vanished after sunset. NWS stops publishing a daytime period once the day is over, and the fallback took the maximum of a one-element list, which is just the current temperature. The page cheerfully reported
H:47° L:45°on a day that reached 68. After dark, today's high is a measurement, so it now comes from the station's own archive. - The wind chart was unreadable for a structural reason I had to be told about. It plotted speed in mph and direction in degrees on one dual-axis chart. Direction is circular, so a northerly wind alternated between 0 and 360 and painted dots along the top and bottom at once. Direction now has its own strip of arrows below the plot, and arrows handle north fine.
hourlyraininis a trap. It reads like "rain this hour" and is a rolling sixty-minute total, so hourly bars built from it count the same rain twelve times.
The traps nobody writes down
- NWS rejects coordinates with more than four decimals. It answers with an HTML error page instead of JSON.
- NWS requires a User-Agent header with a real contact.Without one you get a 403.
- Verify your coordinates before calibrating anything. An early build ran for two days on a point six kilometers off, and every calibration constant had to be recomputed.
- Ambient's API allows one request per second. Sleep between backfill pages.
- On a Mac, launchd cannot read
~/Documents,~/Desktopor~/Downloads. A job that works in Terminal and dies under launchd with "Operation not permitted" is this, every time. - A chart built inside a hidden container sizes itself to zero. Every lazy-loaded tab has to build its charts the first time it is shown.
- Serve only the output directory. The config file with the API keys sits beside the renderer, outside anything the web server can reach.
That last one deserves more than a bullet. I put the page behind Basic Auth and only checked that the auth was enforced sixteen days later. It had been open to the internet the whole time, on a page that pins my house on a map. Nothing came of it. It was still sixteen days of assuming instead of checking, the same mistake as the rain bug in different clothes.
Run it on your own hill
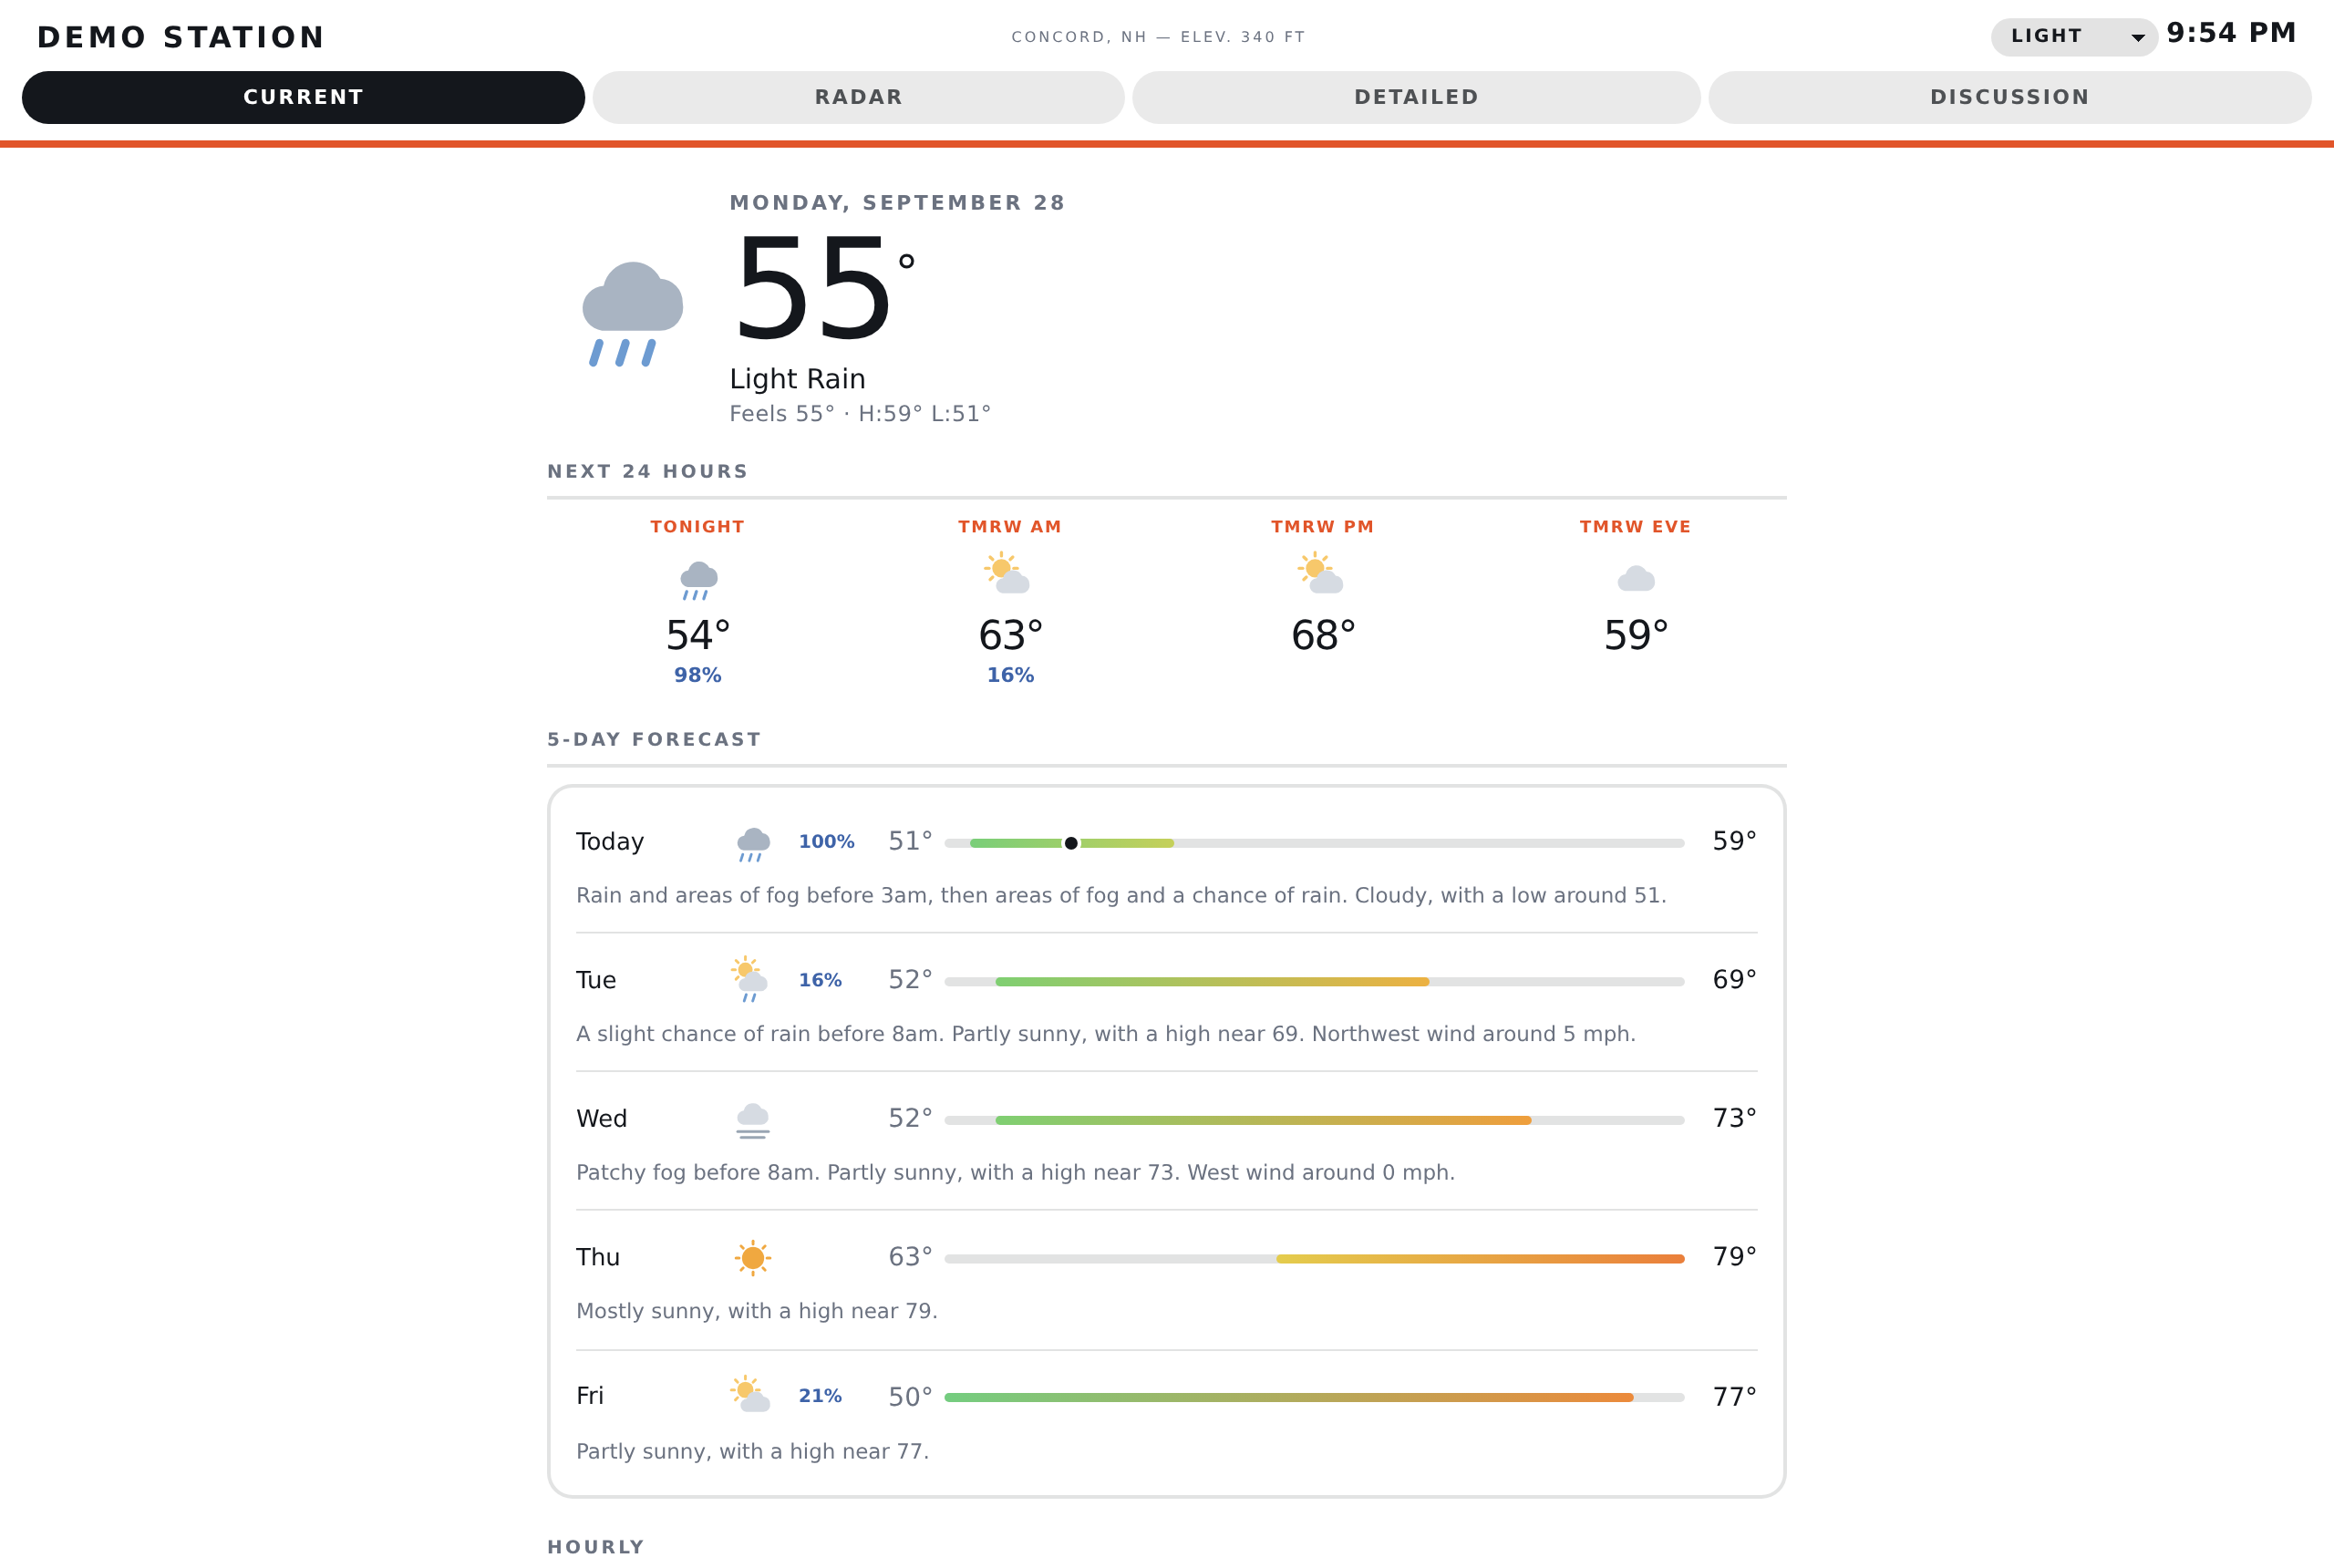
The method travels. Calibrate the public models against whatever your own sensor has recorded and let the difference describe your site.
The code is on GitHub in homelab-builds/tradweather. Everything site-specific lives in one config.json: coordinates, elevation, station name, timezone, your API keys, and your contact address for the NWS header. Clone it, fill in the config, run the container.
Two caveats:
- The NWS half is United States only. Forecasts, alerts, the forecast discussion and NEXRAD radar all come from NOAA. Outside the US the station panels and the Open-Meteo charts still work, and the NWS sections render empty.
- Calibration needs history. It improves on its own as your record grows and is useful after a season. My own record is still spring and summer only, so eight of my twelve monthly wind factors are still fallback values. Ask me again in March.
Credit
The original is Porter Haney's Hilltop House dashboard: the renderer, the calibration method, and the whole idea of scoring models against your own gauge. Mine is that work re-pointed at a different vendor's API and a different hill, published with his blessing.
The next three days of work are in round two: a tab for the mountains, more stations and a wind map.